We have some exciting news for all of our users. We are working on brand new Analytics that will provide deeper understanding of your customers behaviour and company performance. There will be updates coming in several stages. This article will cover the updates coming in the stage 1.
The first update affects several analytics components:
- Sampling
- Empty points in a chart
- Time Zones
- 1-Week sampling
- Other
Sampling
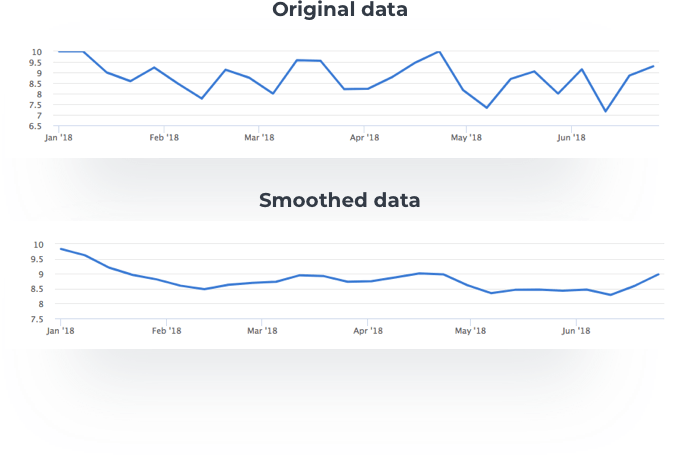
The first update impacts different sampling options in your charts. The way sampling worked until now was that if you chose some sampling option, for example 1-month sampling, and this option had more than 30 values, the chart would be automatically smoothed (it would be a trend chart). This means that it automatically eliminated extremes from your chart.
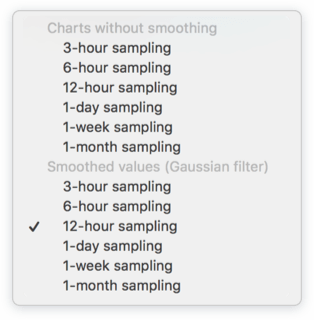
With the analytics update you will now be able to decide which kind of chart you want to see – smoothed or original (raw). There will be this option for each sampling period. For example if you’ll want to see 1-month sampling you will be able to choose between 1-month sampling or 1-month sampling smoothed.
Another updated connected to sampling is that apart from dashboard you will now be able to use sampling filters also in CSAT and CES rating feed.
Empty points in a chart
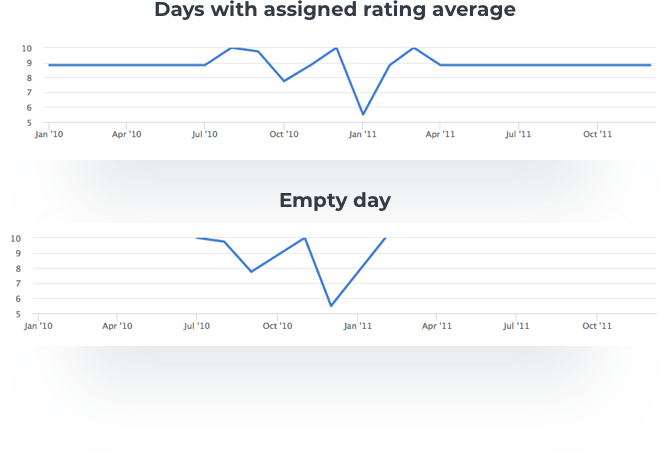
There are some days when your company does not receive any rating. However these days are still included in your charts. The way it worked before was that if there were such days in your chosen time period, Nicereply assigned average metric rating to these days. For example, imagine that you want to see 1-week CSAT sampling. However there is one day when you did not receive any rating. Your average CSAT rating in this period was 6.75. There could not be an empty space in your chart so Nicereply automatically assigned value of 6.75 to this “empty” day.
From now on there will no rating assigned to an “empty” day. The chart will simply connect two closest points. For example if you did not receive any rating on Wednesday, The chart will simply connect Tuesday and Thursday values and won’t assign any rating to Wednesday (this value won’t be included in your sample).
Time Zones
Next analytics update is connected to time zones. Our customers are spread all over the world and we wanted to offer each one of them exact data in their charts in accordance with their time zone. Now you can switch to your time zone, choose whatever sampling you want, and Nicereply will align all your data according to your chosen preferences.
1-week sampling
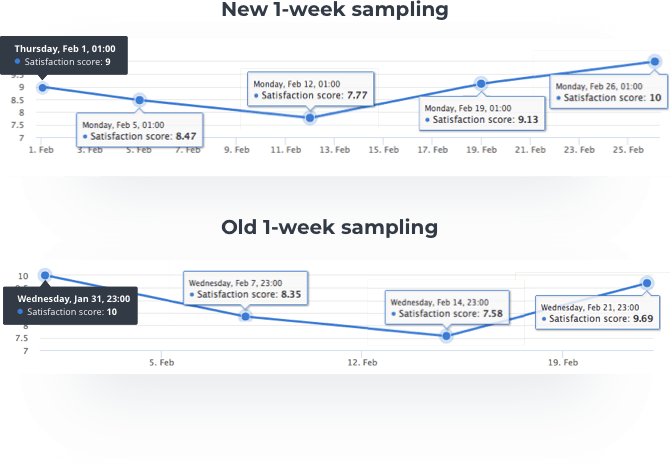
Another update will affect 1-week sampling data. if you chose 1-week sampling in your dashboard before this update the chart was divided in 7-day sections. Let’s say that you wanted to see 1-week sampling from Tuesday 31.7. So Nicereply created a chart that showed data from 31.7., then the next point was Tuesday 7.8., then Tuesday 14.8. and so on. The problem was that the data was not in accordance with work week.
From now on it will work differently. The first point (date) you want to see your data from can be any day of the week, as it was before. The difference is that the next point (date) is always a Monday, so you will be able to see the data for each work week. So again imagine you choose 1-week sampling from Tuesday 31.7.. The chart will show data from 31.7., then the next point is Monday 6.8., then Monday 13.8. and so on.
Other
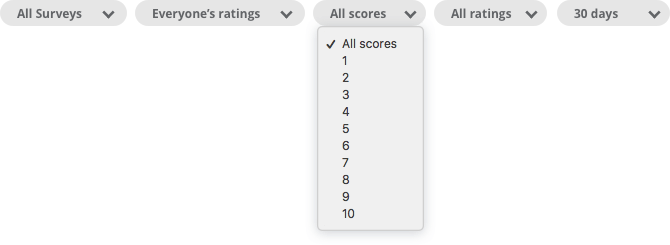
There are a few other smaller updates that will improve your experience with charts and sampling. There is also a small change with wording of our filtering options. If you chose some metric before this update, for example CSAT, you would notice that in the filtering section of the screen there is option to see All ratings – 1,2,3,4… and another option All ratings – with comment or without comment. This was confusing for our users so the first All ratings filter will now be named All scores – 1,2,3,4…
Many more Analytics updates are coming up so make sure to check out our blog and website regularly to be up to date with our work!
