![]()
It goes without saying that customer effort reflects on loyalty and greatly contributes to business growth. You have probably read about this concept in the blog on Net Promoter Score. Even though measuring customer effort may seem like a fully explored area, there are still some interesting questions to answer:
- How does customer service affect loyalty?
- Which customer service activities increase loyalty and which do not?
- Can companies increase loyalty without raising their operating costs?
These questions seem to be essential to the majority of businesses. But, finding clear answers is not easy. Yet, I have got good news: We already know the answers! Professionals from CEB conducted an elaborate study regarding the three questions mentioned above. The study incorporated 75,000+ customers, who have had an interaction with customer service through various channels (phone, email, chat, and so forth), and hundreds of structured interviews with customer service leaders all around the world.
Key findings
The study found that delighting customers by exceeding their expectations (e.g. by offering a refund, free product, or free shipping), makes customers only slightly more loyal than when we just meet their needs.
Hence, it is indeed surprising that 89% of the interviewed customer service managers bet on “exceeding customers’ expectations” and very disturbing that 84% of customers felt their recent interactions “did not exceed their expectations.” Simply put: there is little correlation between satisfaction and loyalty.
So, what should we do? The key insight of the study is that companies create loyal customers primarily by helping them solve their problems quickly and easily. Therefore, refocus from trying to delight your customers, and concentrate on reducing customer effort when resolving their issues.

Measuring customer effort
For effective measurement of customer effort, CEB designed a brand new metric named Customer Effort Score (CES). A single question defined the first version of CES, designed in 2010: “How much effort did you personally have to put forth to handle your request?”, the rating scale starts from 1 (very small effort) to 5 (very big effort).
An improved version of the CES metric, published in 2013, filled the gap in seeking even better interpretation consistency, universal applicability, and cross-industry benchmarking capabilities.
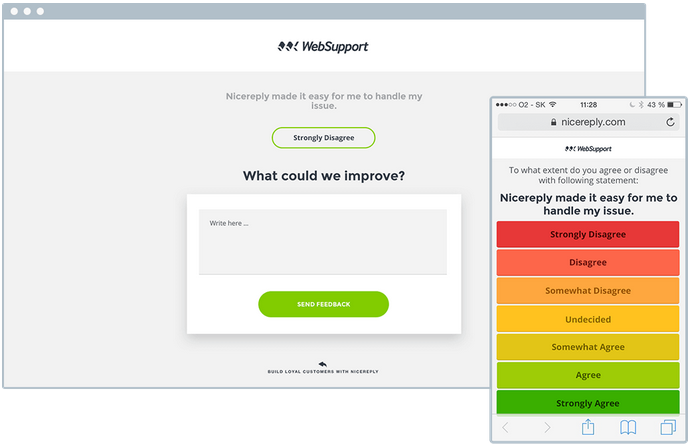
The Customer Effort Score in the version 2.0 evolved into the statement: “[The organization] made it easy for me to handle my issue.” Moreover, this time, customers were asked to express their level of agreement/disagreement with this statement on an enhanced seven-degree scale from 1 (Strongly disagree) to 7 (Strongly agree).
According to published studies, CES 2.0 should be 1.8⨉ better at predicting customer loyalty than Customer satisfaction (CSAT) and 2⨉ finer than Net Promoter Score (NPS).
Difference between CSAT, NPS, and CES
While we typically use CSAT to measure a general level of satisfaction, there’s no further definition of “satisfaction”. NPS clearly focuses on building a group of positively tuned promoters. Neither of these two metrics provides accurate insight into a service or product shortcomings. The Customer Effort Score fills this gap. It instantly incorporates customers into the process of continuous improvement. Any CES feedback directly refers to a specific interaction which, for whatever reason, may or may not match individual customers’ expectations.

It is important to note you can successfully combine two or all three metrics together. Just keep this in mind: Asking for feedback too often will undoubtedly negatively influence your customers’ happiness.
Using CES in everyday life
By design, collecting CES feedback is reasonable when a particular interaction between a customer and customer service ends. For the majority of customer service teams, it represents the point when the client gets a solution, and communication does not reopen from any side for 24–48 hours. Always follow your workflow, system, and experience when you do the fine-tuning of a “closed case state”.
In some cases, it may happen that a customer does not see their issue as closed even 48 hours after the response. In such a case the “worst case” scenario would be negative CES feedback from the customer’s side. It may seem strange at first. However, after a more in-depth reflection, you will find that deliberate issue closure creates a critical checkpoint. The confirmation helps you in making sure your customer really got a solution.
Note: Many support teams think they have resolved the issue when they send an email reply and their customer does not respond. That is where implementation of CES feedback comes in handy: It puts much more emphasis on the cases in which the customer may just be passive and unsatisfied.
Reporting and Insights
In an ideal case, we should link CES feedback directly as an attribute of ticket/case in our system or at least; it should include a quick switch between a CES feedback records and related ticket/case.
Monitor poor (1-3) CES ratings carefully and analyze them in their full communication context to identify & eliminate the root cause of an issue.
From reporting point of view you should be interested in following KPIs:
- Total number of requested CES feedback
- Total number of collected CES feedback
- Percentage of collected feedback from total feedback requests
- Percentual distribution of feedback on CES scale (1-7)
- Change of above listed KPIs over time
Summary
Implementation of Customer Effort Score will help you concentrate on customer loyalty. Since measuring how much effort a customer must put into resolving her/his issue is crucial for your business success. Thanks to CES feedback, customers will point your attention right to the shortcomings of your service or product.


